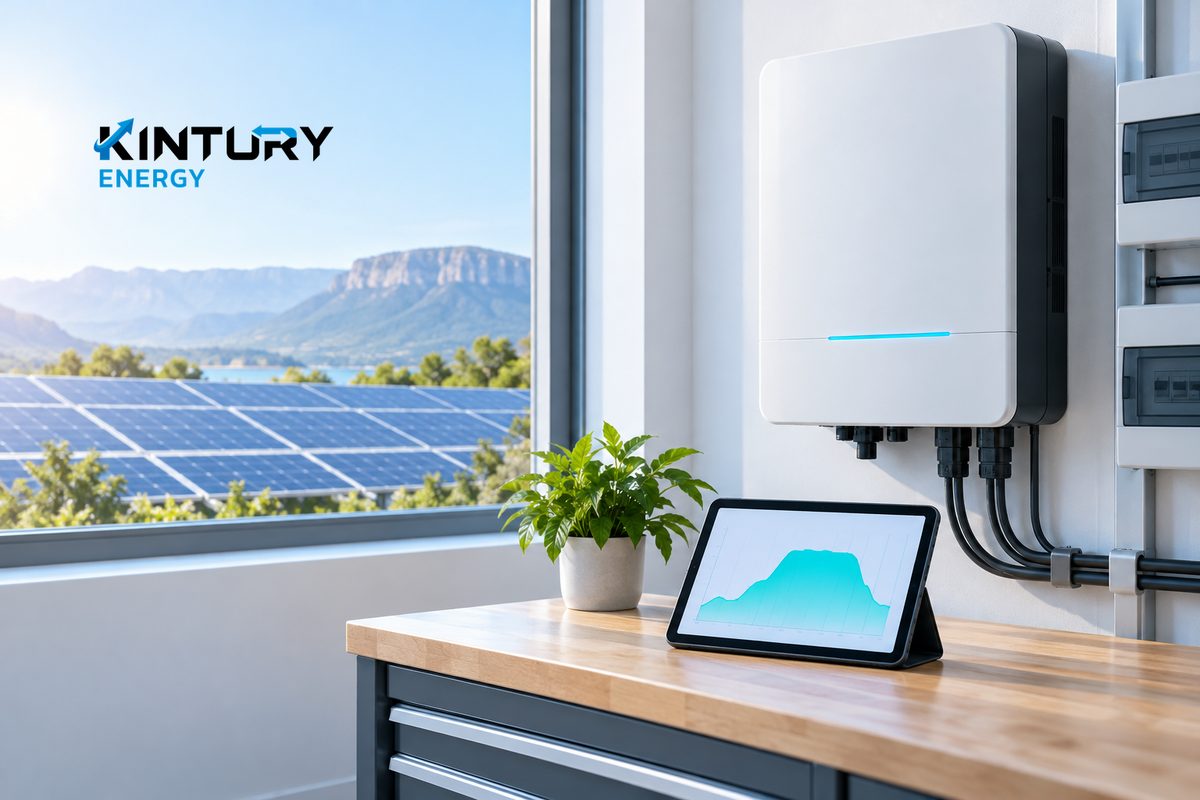

A curve starts a question, not a diagnosis
If solar output rises, stays flat for a while and then falls, do not immediately conclude that modules are faulty or the inverter is undersized. First check what the curve measures and which device records it. A flat top can prompt questions about power limiting, but a single screenshot cannot establish the cause in an actual system.
Understand clipping as power limiting
SAM's manual describes simulated power clipping: when calculated AC output exceeds the combined inverter nameplate capacity, the model limits output to that capacity. This helps explain why potential output from the modules and delivered power may differ at certain times. A modeling explanation should not be used to diagnose every system's graph without site data.
Keep data before, during and after the plateau
Record the system name, date, time interval, units and curve label, together with downloadable historical files if available. Retain the periods around the plateau rather than cropping to the peak alone. Note which days it recurs and whether alerts or shutdowns occurred. If the app combines several devices, ask the service team how to obtain device-level reporting.
Ask where the displayed value is being limited
Have the responsible team check the inverter model rating, authorized settings and relevant operating context. Ask them to distinguish evidence-backed findings from outstanding suspicions. Do not increase limits, reset equipment or experiment with settings to raise the curve yourself; the active settings may relate to the project's design and requirements.
Do not judge economics from the peak alone
If the team confirms power limiting, ask how it affects energy over the relevant period and whether the original design accounted for it. The highest point on the curve does not describe annual performance or all bill savings. Replacing an inverter therefore needs a documented comparison and costs, rather than being an automatic response to a plateau.
Finish with a traceable assessment
When consulting Kintury Energy within the project's service scope, prepare full-period graphs, equipment models and dates of the observed pattern. Request a summary of what was checked, the cause identified and follow-up needed. If the cause remains unconfirmed, keep it pending rather than declaring the system faulty or certainly normal. Article images illustrate curve concepts, not actual customer data or inspection results.